

RETAIL, FOOD SERVICE & CONSUMER ACCESS
From grocery stores to school cafeterias, this category captures the downstream value created when ag products enter the food system and reach consumers.
Direct farm-to-consumer sales, CSA boxes, and farmers markets
Retail packaging, branding, and food safety protocols
Institutional buyers: schools, food banks, health systems
Restaurants, grocery stores, and regional food hubs
Economic value of ag-connected tourism and hospitality

1. Ag Census Interactive Maps
DATA HIGHLIGHTS:
Farms selling direct to consumers earned $68,252 per farm, or over $165 million countywide.
44.79% of producers report farming as their primary occupation, indicating high retail dependency.
This supports farm box, agri-tourism, and specialty crop marketing in local food economies.

2. The Economic Impact of Avocado Growers in Riverside County
DATA HIGHLIGHTS:
Title & Highlights
Annual economic output from avocado growers in the county: $82.4 million, equating to ~$225,750 per day
Supports ~ 1,022 full-time equivalent jobs, including indirect employment
Generates $33.1 million in labor income and $2.1 million in indirect business taxes annually
Impact on Riverside County
Boosts local household income and supports county programs via tax revenue
Strengthens rural employment and ag-sector supply chains through job creation

3. USDA ERS Food Dollar Series
Data Highlights:
This dataset tracks how every dollar spent on food is distributed across the U.S. economy. Only 14.5% goes to farm production, while over 31% goes to retail and foodservice. It highlights how most of the food economy’s value is captured downstream from the farmgate.
Economic Impact:
Retail and foodservice in Riverside County may generate $3–5B in value beyond crop production.
Underscores the need for investment in local branding, cold storage, and logistics.
Validates downstream sectors (e.g., restaurants, grocers) as critical to ag economic impact.

4. USDA–CRS Marketing and Pricing in the U.S. Fruit and Vegetable Industry
Data Highlights:
In 2022, producers captured 39% (fruits) and 28% (vegetables) of the retail consumer dollar, with logistics, packaging, and services accounting for the rest
Shows higher farm share in produce relative to overall food.
Boosts regional farm incomes when local aggregation and direct sales occur.
Reveals economic leakage through wholesale/retail chains.

5. CRS Report on U.S. Retail Food Price Data
Offers methodology for gauging farm vs. marketing shares, aiding identification of producer income within the food chain
Economic Impact:
Enables differentiation between value added by services vs. raw agriculture.
Supports measurement of producer resilience through price-share trends.
Assists policy framing around farm profitability.

6. BLS Occupational Employment and Wages – Riverside MSA (2024)
Data Highlights:
This report provides detailed occupational wage data for the Riverside-San Bernardino-Ontario Metropolitan Statistical Area as of May 2023, published in July 2024. It shows that food preparation and serving-related occupations employ approximately 10.1% of the region’s workforce. These workers earn a mean hourly wage of $19.66, illustrating the scale and economic contribution of food system labor in the Inland Empire.
Confirms that over 150,000 workers in the region are engaged in food preparation, service, and related sectors.
Provides verified average hourly wages, enabling wage-based multiplier modeling in economic impact calculations.
Demonstrates the importance of food system labor in both agriculture and consumer access, especially within underserved or tourism-driven communities.

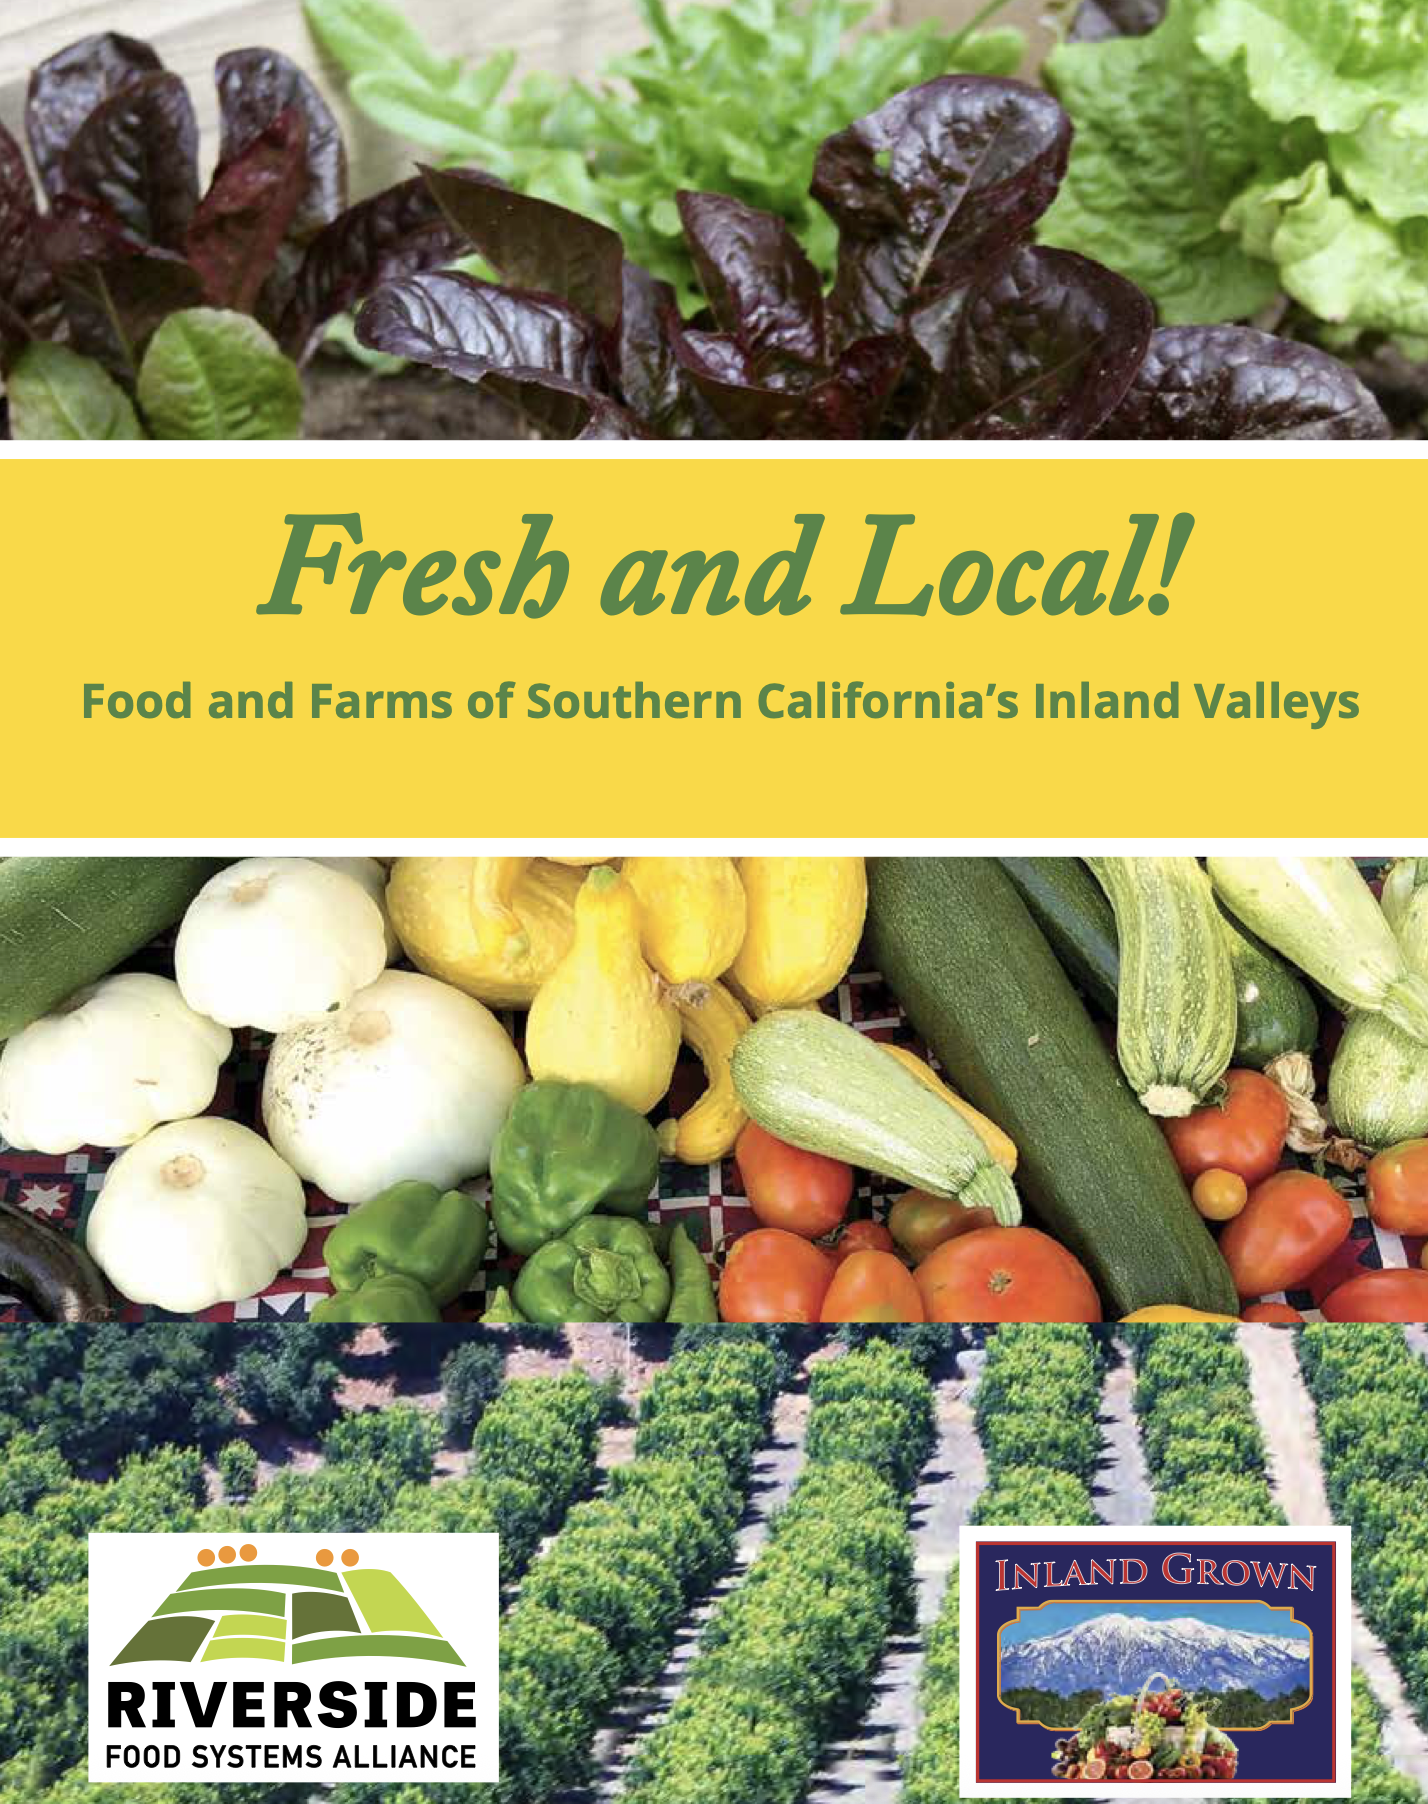
7. RCRCD – Fresh & Local! Inland Grown Guide (2019)
Data Highlights:
This regional guide outlines the breadth of Riverside County’s local food system, including farmers markets, CSAs, mobile food vendors, and direct-to-consumer (DTC) agriculture programs. It estimates that over $95 million circulates annually through these alternative retail channels, reinforcing their role as essential drivers of community-based economic activity. The guide also maps food access gaps and highlights opportunities for market expansion, particularly in underserved areas.
Demonstrates that farmers markets and CSAs alone account for $95 million in annual local economic activity.
Validates the importance of mobile and alternative food retail models for underserved communities.
Supports investment in small-scale infrastructure, like refrigeration for CSA hubs or marketing support for DTC operations.
8. AFBF – America’s Farmers Serve Up Your Football Favorites (2024)
Summary:
This article from the American Farm Bureau Federation highlights the critical role farmers play in sustaining America’s food culture, particularly around consumer-driven events like football season. It showcases how agricultural production supports entire food chains—growing the raw inputs used in chips, dips, dairy, meats, and beverages. The article reinforces the interconnectedness of rural agriculture and urban consumer spending, offering a lens through which seasonal demand, marketing, and supply chain value can be understood.
Economic Impact:
Illustrates how consumer-driven food events like Super Bowl weekend result in billions of dollars of food sales tied to U.S. agricultural products.
Highlights agriculture’s role in serving not just raw goods but processed, branded, and highly valued retail products.
Validates the economic ripple effect of agriculture, from farm production to national marketing, logistics, and retail execution.

9. Visit Greater Palm Springs – Economic Impact of Visitors (2024)
This report analyzes the total economic contribution of tourism in the Greater Palm Springs region, revealing that in 2023, visitors spent over $7.1 billion, supporting more than 49,000 jobs and generating $922 million in tax revenue. It highlights visitor spending across lodging, dining, retail, transportation, and recreation, with food and beverage alone accounting for 19.7% of total visitor spending. The report emphasizes tourism’s synergy with agriculture through culinary tourism, agritourism, festivals, and food and wine experiences.
Shows that $1.4 billion in annual visitor spending is tied to food and beverage purchases, directly intersecting with local agriculture.
Supports integration of farm-to-table and agri-branded events (e.g., Date Festival, food & wine festivals) into tourism strategy.
Demonstrates the potential for cross-sector investment in local food systems as an economic development tool.

10. Riverside County Regional Intelligence Report – December 2024
Data Highlights:
This comprehensive economic analysis details Riverside County’s sector-by-sector performance, including updated data on agriculture, employment, business activity, and infrastructure. The report notes a resilient ag sector with $1.54 billion in 2023 crop value, supported by rising investment in water and transportation infrastructure. It links agriculture to broader regional growth through real estate, logistics, and labor market integration, underscoring the industry’s importance in maintaining economic stability during inflationary cycles.
Highlights agriculture as a stable contributor to Riverside’s GDP, with strong ties to regional logistics, real estate, and utilities.
Supports workforce development planning by identifying sectors with labor shortages and ag-adjacent job growth.
Affirms the role of infrastructure investment (e.g., water and freight corridors) in supporting continued ag productivity.
