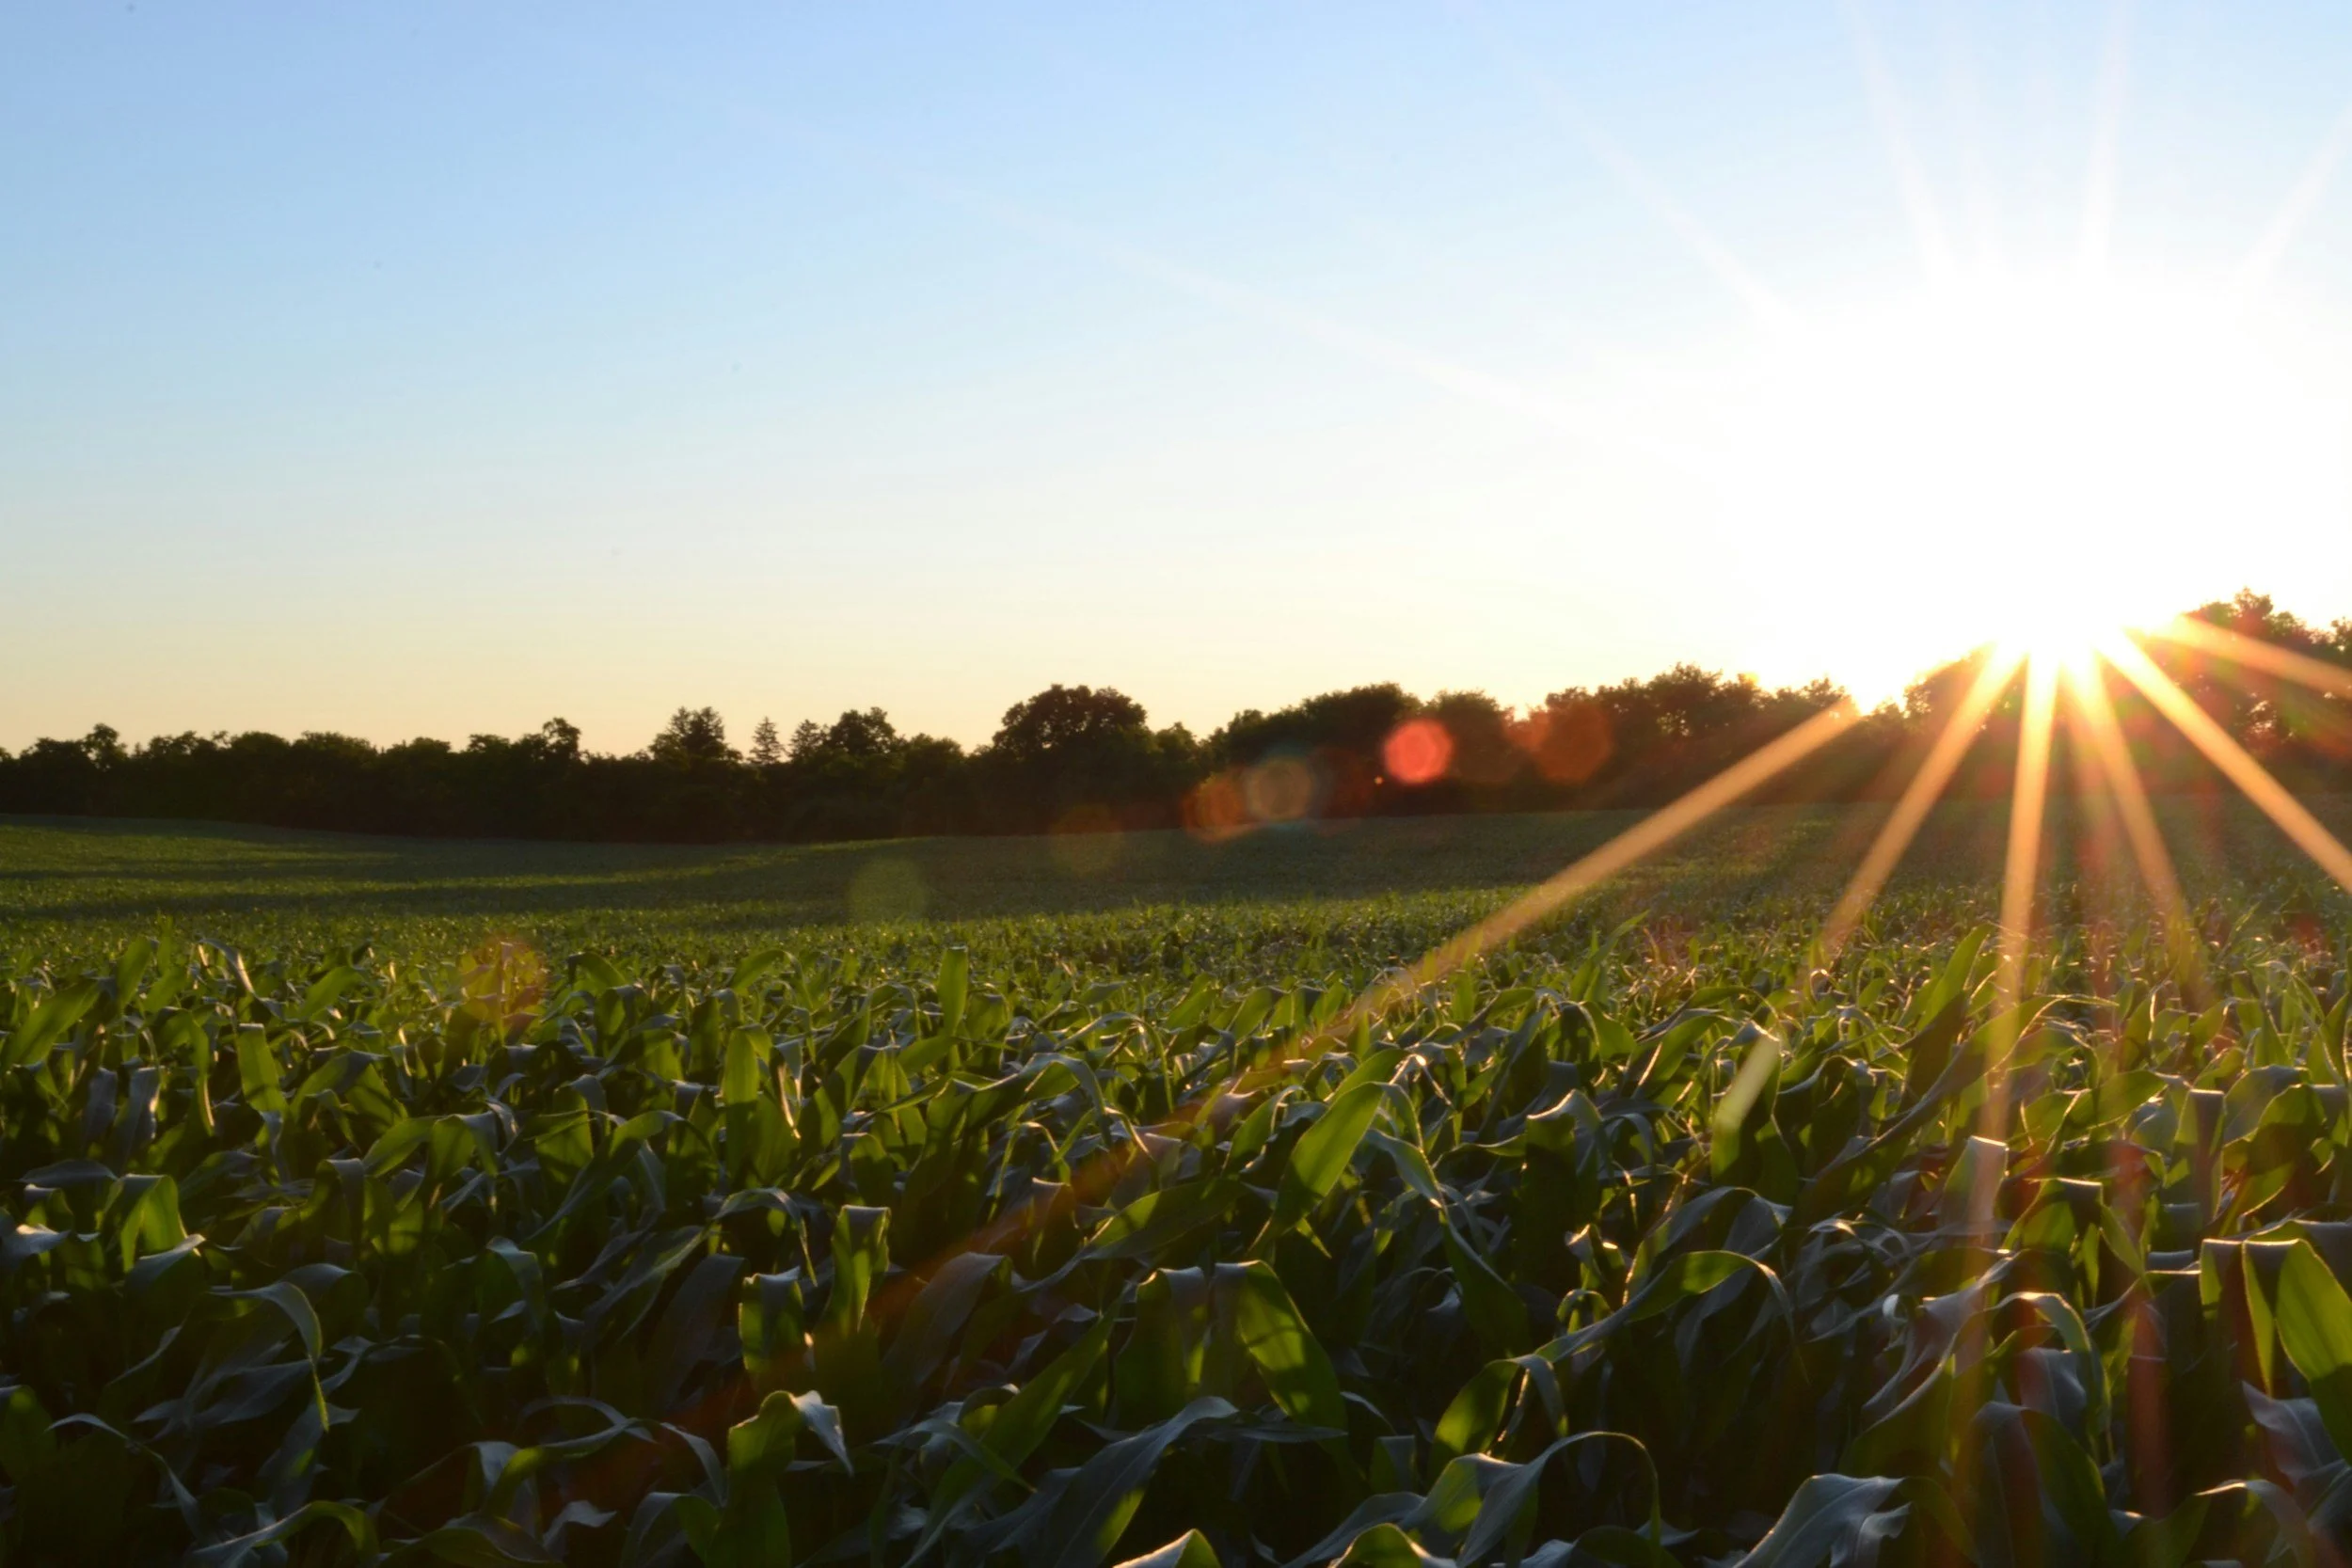
Farm Production & Land Use
is where Riverside County’s agricultural economy begins. This category reflects the land, labor, and raw output that fuel the entire value chain.
This section covers crops, livestock, nursery, and aquaculture
Relies on water, workforce, and productive land
Drives local food systems, exports, and land use planning
1. Riverside County Agricultural Commissioner: Riverside County Crop Report 2023
Data highlights:
Total crop value: $1.540 billion (2022: $1.490 billion)
Top commodity categories and year-over-year % changes: e.g., Nursery (+17.5%), Aquaculture (+17.2%), Livestock/Poultry (−31.5%)
2. Ag Census Interactive Maps
DATA HIGHLIGHTS:
Riverside farms generated $270.2 million in total net cash farm income in 2022.
Average market value of land and buildings per farm: $2.96 million; machinery/equipment: $156,527.
Farms occupy 7.8% of county land, across 2,424 operations averaging 149 acres each.
3. USDA Economic Research Service: Land Values Summary - 2023
Data Highlights:
Farm real estate average: $4,080/acre (+7.4% from 2022)
U.S. cropland: $5,460/acre (+8.1%)
U.S. pasture: $1,760/acre (+6.7%)
4. USDA NASS: Census of Agriculture: 2022 Census of Agriculture 2022
Data Highlights:
Uniform county-level data coverage
Number of farms, acreage, production methods
Useful for benchmarking labor and land-use trends
5. California Department of Food and Agriculture: California Agricultural Export Statistics 2022–2023
Data Highlights:
CA ag exports reached $23.6 billion in 2022 (+4.4%)
Trends for export-dependent sectors relevant to Riverside
6. California Department of Pesticide Regulation: Pesticide Use Summary 2022
Data Highlights:
Regional pesticide application trends
Compliance and environmental regulation impacts
7. Riverside County Planning Department: Agricultural Employee Housing Ordinance 2025
Data Highlights:
Riverside County’s new ordinance streamlines approvals for up to 36-unit agricultural worker housing developments.
Developer costs include permitting, infrastructure, and compliance—estimated at ~$10,000–$20,000 per unit.
This ordinance reduces capital barriers for temporary farm housing and supports workforce stability.
8. Crop Insurance Indemnities: Riverside County
Data Highlights:
Riverside producers received collective indemnities exceeding $170 million from hail-related claims alone (2022–2023).
Demonstrates dependency on federally backed risk mitigation—critical to farm financial resilience.
Premium subsidies (~63%) offset direct costs and stabilize production cycles.
9. Farm Equipment Sales Tax Exemption
Data Highlights:
Riverside County farmers benefit from a 5% state sales tax exemption on tractor and irrigation equipment purchases.
For equipment investments of $200,000/year, this saves ~$10,000 annually.
This incentive reduces capital costs and enhances on-farm modernization.
10. UCR Awarded $1.5M for Sustainable Agriculture Initiatives
Data Highlights:
The University of California, Riverside (UCR) received $1.5 million in state grants from CDFA to support sustainable specialty crop farming, including youth engagement, waste management, and ag-tech programs.
Funds are directed toward farm-focused infrastructure such as on-farm composting, nutrient monitoring systems, and educational outreach—representing a public investment in regenerative agriculture.
Reflects how grants amplify farm operational capacity and contribute to long-term productivity and environmental stewardship.


